Do you ever think about how your email marketing campaigns measure up against others in your industry? Ever considered what your unsubscribe or bounce rates look like in comparison to your competitors? Have you ever looked at the email marketing performance of businesses in other industries, sought out their top performers, and figured out what you could learn from them?
Several studies, including those by email service providers Constant Contact and MailChimp, have gathered data from their customers and organized it by industry. This data gives you high-level insight into the metrics and core numbers that you should be accurately keeping track of everytime you send an email. These numbers are rough benchmarks that you can use as targets when optimizing and setting goals for your campaigns.
Open Rates
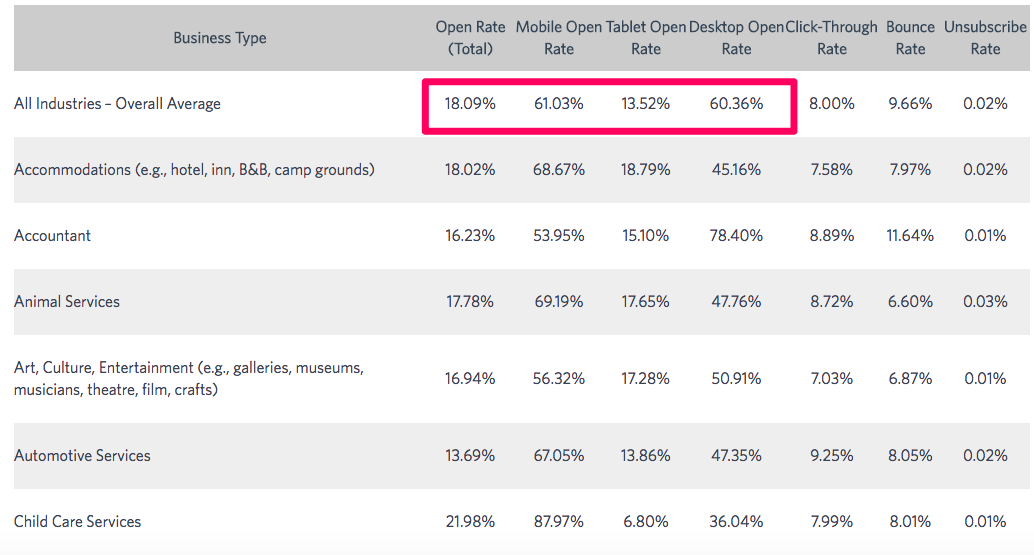
Are one out of every six people opening your emails? If so, you’re doing better than the average business. According to Constant Contact, statistics show that across all industries the average total open rate is 18.09%. When we break that down by device we see that email sent to mobile devices have a 61.03% open rate, tablets have a 13.52% open rate, and desktop has a 60.3% open rate.
According to the study, Religious organizations (27.31%), Civic/Social Membership (24.38%), and Education – Primary/Secondary (25.24%). The lowest performers were Technology (12.52%), Retail (11.92%), and Marketing/Advertising/Public Relations (10.77%).
Although the typical reader of this blog will fall into the latter category, it’s no reason to become disheartened. Companies in these industries send email very frequently and often times they may not have an established relationship with their prospect. On the other hand, the companies on the high end of open rates already have a much more established relationship with their prospects, i.e., a member of a church, community group, or a parent who receives an email from their child’s school. The established trust and relationship aren’t the same.
Transactional Emails
Transactional emails, or emails that triggered by a user’s action like a receipt or subscription, have a much higher open rate than an email that is non-transactional. According to a study by Experian, transactional emails receive eight times the opens compared to non-transactional marketing emails.
![]()
This may seem obvious when classifying a transaction as an email that confirms when there has been an exchange of money but that isn’t always the case.Transactional emails can cover any action a user takes which leads to another action, such as:
- Return/Exchange confirmation – The email that confirms an item has been successfully returned or exchanged by the customer.
- Shipping confirmation – The email that is sent once an order ships to the customer
- Abandoning a shopping cart – When a customer fills up their shopping cart but doesn’t complete the purchase
- Password reset – when someone requests to reset their password
A non-transactional email would be some type of promotion or marketing message that the user did not trigger. What many businesses fail to realize is that transactional emails are fertile ground to both build a tighter bond and relationship with a customer as well as sell more of your product/service to that same customer through cross-sells, up-sells, and other promotions that are related to their purchase. Customers are much more likely to buy when they are already in a buying mindset.
Click-Through Rates
Open rates get all the glory but getting someone to take action and click is a bigger ask and much more important for businesses. Looking again at the study by Constant Contact we see that Publishing (13.85%), Transportation (13.05%), and Government Agency or Services (9.81%) have the highest click-through rates while Other (5.6%), Restaurant/Bar/Cafe/Caterer (4.87%), and Salon/Spa/Barber (4.12%) had the lowest.
As you can see there are no two industries that are in the top (or bottom) three in either open or click-through rates. None of the industries at the top of the click-through rate metric share the same position when it comes to open rate but their users engage more with their email since they take action a higher percentage of the time. This shows that it’s important to gauge your performance across several different metrics so you can get the complete picture of how your campaigns are performing.
List Churn
Open rate and click through rate are both seen in a more positive light. You can find plenty of articles on both topics but often times the topic of unsubscribe rates or list churn isn’t as sexy. Unsubscribe rate is measured as the number of people who choose to no longer receive email from you in the future compared to the number of people who received that particular campaign.
Unsubscribe rates are caused by things like a disconnect between the message and the subscriber, emails that lack value and emailing too frequently. Industries with the highest unsubscribe rates include Home & Building Services (%.04), Animal Services (%.03), and Health Professional (%.03). Industries with the lowest unsubscribe rates include Other (.01%), Marketing/Advertising/Public Relations (.01%), Fitness Center/Sports/Recreation (.01%).
It may seem counterintuitive that businesses in the Health Professional industry have higher unsubscribe rates than Marketing/Advertising/Public Relations companies but please remember that unsubscribe rate uses the ratio of the number of unsubscribe requests out of the total number of emails sent so industries that email more heavily may have lower unsubscribe rates because their total number of emails sent is much higher.
The Rise of Mobile
On average, of all the industries taken into account by Constant Contact, companies achieved an overall open rate of 18.09%, with mobile open rates coming in at 61.03%, desktop at 60.36%, and tablet at 13.52%. When looking at the data is very interesting to see that every industry has above 50% open rates for mobile.
Statistics show that mobile email is here to stay. According to a study by Litmus, desktop represents 17% of all opened email, webmail comes in at 36%, and mobile at 47%.

Fluent reported that 3 out of every 5 consumers check their email on their mobile phones while 75% of users say that the device they use most often to check their email is their cell phone. It makes sense because people who own both a smartphone and a computer are going to have their phone more readily accessible than their computer most of the time.
Bounce Rate
Bounce rate is another metric that doesn’t get as much ink as open rate and opt-in rate but is still a critical metric that marketers should track. Bounce rate is determined by measuring the number of emails sent compared to the number of emails that are delivered. In the data provided by Constant Contact, we see that the industries with the lowest bounce rates are Retail (6.36%), Animal Services (6.6%), and Art/Culture/Entertainment (6.87%). On the other end of the spectrum, industries with the highest bounce rates are Salon/Spa/Barber (13.17%), Manufacturing/Distribution (12.13%), and Legal Services (12.12%).
Again we see that even though an industry like Retail, which is typically a heavy email marketing industry, has a low bounce rate we can deduce that this is most likely because the total number of emails sent is higher than most other industries which would lower their bounce rate percentage.
Hard Bounces vs. Soft Bounces
What’s interesting about bounce rate is that there are two different types of bounces – hard bounces and soft bounces. According to MailChimp, we see that a soft bounce means that the recipient is “temporarily unavailable.” This could mean that they are on vacation or that their mailbox is full.
In the MailChimp study, we see that Construction (1.56%), Architecture/Construction (1.41%), and Manufacturing (1.41%) have the highest soft bounce rates.

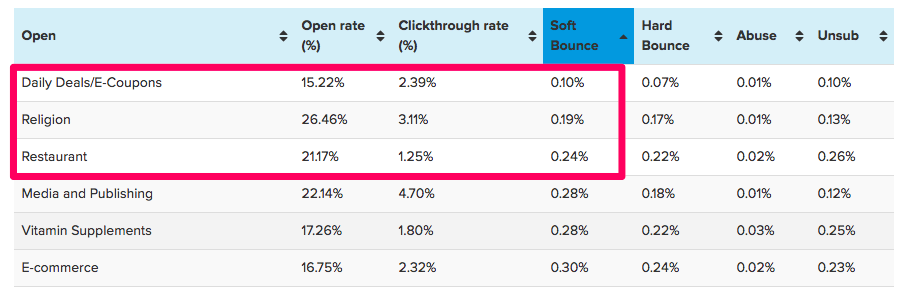
We can also see that Daily Deals/E-coupons (.10%), Religion (.19%), and Restaurant (.24%) have the lowest soft bounce rates.
From these numbers, we might be able to infer that there is an industry trend among the construction industry in regards to email. Such as not using email very often, having full mailboxes, or leaving their vacation reply active for longer periods of time.
We can also determine that the industries with the lowest soft bounce rates are those that email more often. For example, restaurants frequently email their lists about specials and promotions, religious organizations may often email their lists about fundraisers and events, while daily deal and e-coupon sites may literally email their lists every day.
Hard bounces mean that your email wasn’t delivered because the recipient’s email address failed. The email may have been sent to the wrong address, it may no longer exist, or your message may have been caught by a spam filter. If you see a large number of hard bounces during a campaign you should definitely review your bounce records for clues and insight into what’s causing your rate to rise.
Not surprisingly the industries at the top and bottom of hard bounce rates remain consistent with their soft bounce counterparts. The highest three bounce rates belong to Construction (1.2%), Architecture/Construction (1.08%), and Manufacturing (.99%). The lowest hard bounce rates belong to Media and Publishing (.01%), Religion (.01%), and Daily Deals/E-Coupons (.07%).
Both Constant Contact and MailChimp have over 10 million users collectively and send billions of emails per month so the sample size is fairly extensive. Keep in mind that the figures are skewed towards smaller businesses who use free accounts at either email service provider.
Abuse
Worse than a high unsubscribe rate or high bounce rate is a high abuse rate. An abuse complaint occurs when a recipient of your campaign flags your button as spam inside of their email client. When this happens it’s usually because the recipient does not remember you or signing up for your mailing list.
To prevent spam complaints you’ll want to make sure that the “From” and “Subject” lines of your email have either your name or your company name (whatever they saw when they signed up) so that subscribers will recognize you immediately.
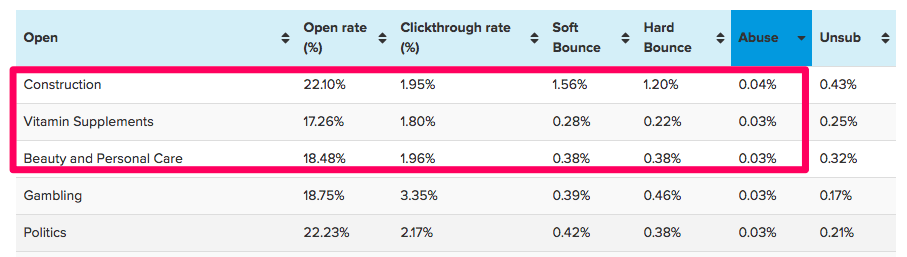
Looking at the chart we can see that the Construction (.04%), Vitamin Supplements (.03%), and Beauty/Personal Care (.03%) have the highest abuse rates.
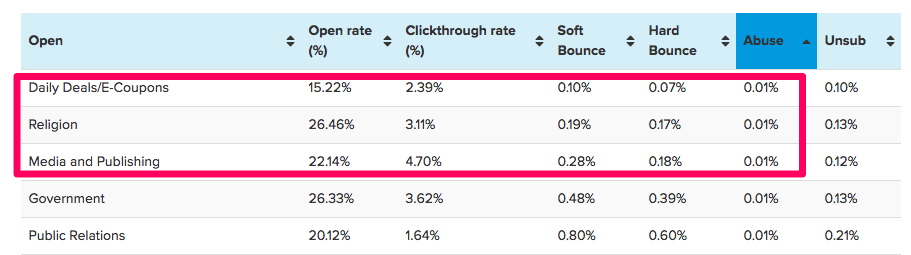
Religion (.01%), Public Relations (.01%), and Media/Publishing (.01%) round out the lower end of abuse rates.
Other common reasons for spam complaints (and high abuse rates) are the following:
- An Old List – Large gaps in contact time with your list participants can lead to list rot. If you email someone that you haven’t contacted in a while it could lead to an abuse complaint. Make sure to stay in regular contact with your list.
- Purchased/Rented Lists – Buying a list from a third party can be a fast track to high abuse rates. You should avoid using third-party lists if at all possible. If you want access to someone’s list you should ask for them to mail your offer to their list directly.
- Contests/Events – Collecting business cards during a trade show or other event can seem like a great way to collect emails but someone who gave you their info to win a prize doesn’t necessarily want to receive your email campaigns. Make sure to ask them for their permission to email them (whether online or in-person) before you throw them on your mailing list.
The Truth About Email Metrics
All of these statistics are great benchmarks and can give you a rough estimate of how you fare against the field of your competitors. But, these numbers only have real truth once you take into account your own industry, business, and customers.
Macro data like this is valuable but what matters most to you and your business is your personal experiences and the historical data that you’ve gathered from putting in the work and getting results. This is the only way that you’ll gain true knowledge of your performance and learn how you can help your business grow.
Have you seen any interesting correlations between your results and this study? Have you outperformed the reported averages? Share your experience in the comments below!
About the Author: Neil Patel is the cofounder of Neil Patel Digital.


from The Kissmetrics Marketing Blog http://ift.tt/2FAVK7Y
via IFTTT